This article is part 2 of the Price Action section of our Stock Market Learning series created by SMJ. It offers a comprehensive and straightforward guide to understanding and using support and resistance levels in the stock market. You will learn what support and resistance are, why they’re important, how to identify these levels, and practical strategies for applying them effectively in your trading decisions. Our goal is to help both beginners and experienced investors gain a solid foundation in using support and resistance to enhance their market analysis and trading strategies.
Trading involves a significant learning curve and can be challenging to master. It requires time, effort, and consistent practice to develop the necessary skills and understanding. While this series aims to provide valuable insights and guidance, becoming proficient in trading demands dedication and ongoing education.
Support and resistance are two of the most fundamental concepts in technical analysis, used to identify key price levels where an asset’s movement might pause or reverse. These levels are driven by market psychology and the balance between supply and demand, making them essential tools for traders to determine entry and exit points.
Understanding support and resistance can give traders a significant edge in the stock market, where volatility and fluctuations are common. By identifying these levels on price charts, traders can better anticipate potential price movements and make more informed trading decisions.
Also read: An Introduction to Price Action Trading: What & Why?
Understanding Support
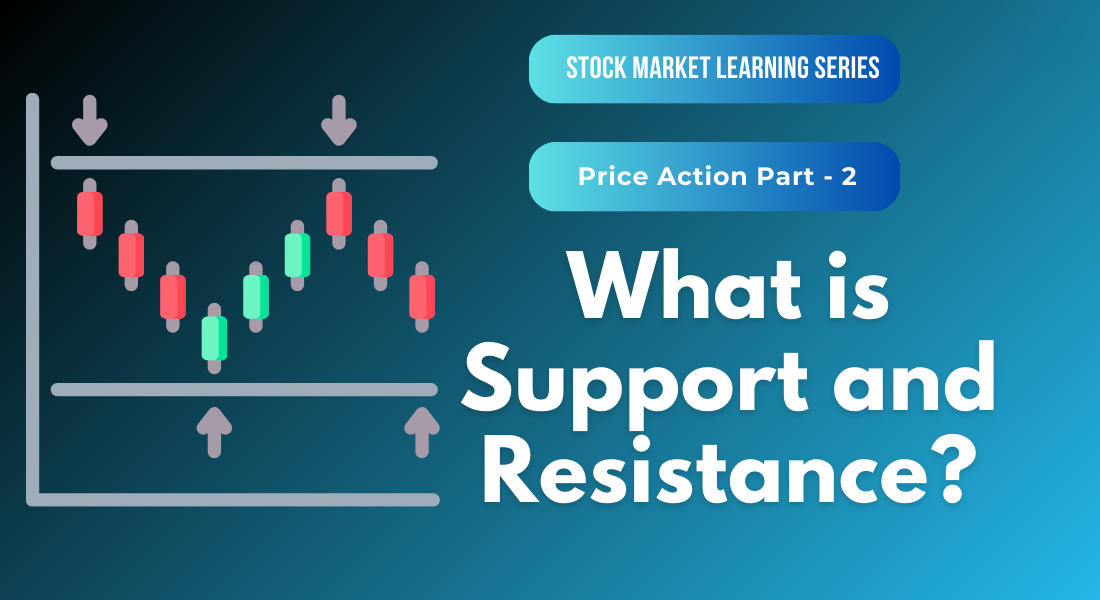
What is Support? Support is a price level where a downtrend in a stock or index is expected to pause or reverse due to a concentration of buying interest. It represents a price point at which traders believe the asset is undervalued, prompting them to purchase, which prevents the price from falling further.
Psychology Behind Support
Market Sentiment – As prices fall, they eventually reach a level where buyers see value, causing an increase in demand. Sellers may become reluctant to sell at lower prices, thus halting the decline.
Supply vs. Demand – Support forms when demand exceeds supply at lower price levels, helping to stabilize or increase the price.
Static vs. Dynamic Support
Static Support – Fixed price levels where the stock has repeatedly failed to fall below. For example, a stock that bounces back from ₹200 multiple times forms static support at that level.
Dynamic Support – Moving support levels, such as moving averages (e.g., a 50-day moving average), which change as the stock price fluctuates.
Psychological Levels – Round numbers like ₹100, ₹500, or ₹10,000 often act as support levels because traders mentally anchor their decisions around these values.
Support Zones vs. Exact Levels
Support isn’t always a precise price point but often exists over a range. For example, if a stock finds buying interest between ₹500 and ₹510, this can be considered a support zone where buyers step in.
How Support Works in Different Timeframes
Short-Term vs. Long-Term Support – Support identified on shorter timeframes, like hourly charts, may only affect day traders, while long-term support from weekly or monthly charts holds greater significance for investors with longer horizons.
Multiple Timeframes – Traders often look at support levels on different timeframes (e.g., daily and weekly charts) to confirm their strategy and identify strong levels of buying interest.
Support in Uptrends vs. Downtrends
Support in an Uptrend – In an uptrend, prices can pull back and find support at previous lows before resuming the upward movement, offering traders a chance to buy at a relatively lower price.
Support in a Downtrend – During a downtrend, support levels indicate where prices may pause or reverse, giving traders insight into potential entry points or where to exit a short position.
Understanding Resistance
What is Resistance? Resistance is a price level where an uptrend in a stock or index is expected to pause or reverse due to a concentration of selling pressure. It represents a point where traders believe the asset has become overvalued, leading to increased selling interest.
Psychology Behind Resistance
Market Sentiment – As the price of a stock increases, sellers become more willing to sell, believing that the asset has reached its peak for the short term. Buyers may also hesitate to buy at higher prices, reducing demand and creating resistance.
Supply vs. Demand – Resistance forms when supply begins to exceed demand at higher price levels, which halts the price increase and sometimes reverses it.
Static vs. Dynamic Resistance
Static Resistance – Fixed price levels where the stock has previously failed to move higher. For example, a stock repeatedly failing to cross ₹500 forms a static resistance at that price.
Dynamic Resistance – Moving resistance levels that change with the market, such as moving averages (e.g., a 50-day or 200-day moving average acting as a resistance level).
Psychological Levels – Round numbers, like ₹1000 or ₹10,000 in Nifty, often act as psychological resistance due to traders’ mental anchors around these values.
Resistance Zones vs. Exact Levels
Resistance is not always an exact price point; it can occur over a price range. For instance, if a stock faces resistance between ₹500 and ₹510, this range can be considered a resistance zone where selling pressure builds up.
How Resistance Works in Different Timeframes
Short-Term vs. Long-Term Resistance – Resistance identified on daily charts may only affect short-term traders, while resistance on weekly or monthly charts holds more significance for long-term investors.
Multiple Timeframes – Traders often analyze resistance across different timeframes (e.g., hourly, daily, and weekly charts) to strengthen their strategy and confirm resistance levels.
How Support and Resistance Levels Are Identified
Historical Price Data
One of the simplest ways to identify support and resistance (S&R) levels is by looking at historical price data. Traders and investors examine price charts to find areas where the price has consistently paused or reversed.
- Support – Identified at price points where the stock has repeatedly stopped falling and rebounded upwards.
- Resistance – Identified at price levels where the stock has repeatedly struggled to rise above and has reversed downward.
Trendlines
Trendlines are drawn on a chart by connecting two or more significant lows for support or highs for resistance.
- Uptrend Line (Support) – In an uptrend, a line connecting higher lows indicates dynamic support, showing where the stock may find buying pressure.
- Downtrend Line (Resistance) – In a downtrend, a line connecting lower highs indicates dynamic resistance, marking areas where selling pressure could occur.
Round Numbers and Psychological Levels
Prices often find support or resistance at round numbers (e.g., ₹100, ₹500, ₹10,000) due to psychological biases. Traders and investors tend to make decisions based on these round numbers, leading to concentrated buying or selling around these levels.
Example – If a stock consistently rebounds around ₹500, this round number becomes an informal support level.
Moving Averages (MA)
Moving averages (e.g., 50-day, 200-day) are used as dynamic S&R levels. As the stock price moves, these averages provide potential areas where the price might halt or reverse.
- Support – Price often finds support when it nears a rising moving average, such as the 50-day MA.
- Resistance – Similarly, in a downtrend, the price might face resistance near a declining moving average.
Fibonacci Retracement Levels
Fibonacci retracement levels (e.g., 23.6%, 38.2%, 61.8%) are often used to identify potential S&R levels. These are calculated by drawing a Fibonacci retracement between the recent high and low, with traders anticipating that the price may reverse at these levels.
- Support – If a stock pulls back after a rally, Fibonacci levels can indicate where it might find support and resume its upward movement.
- Resistance – In a retracement within a downtrend, Fibonacci levels show where the price might face resistance before continuing its decline.
Volume-Based Indicators
Areas with high trading volume often indicate significant S&R levels. When a stock is traded heavily at certain prices, these levels tend to act as barriers.
- Support – High volume at a lower price can suggest strong support, as many buyers have entered the market.
- Resistance – Conversely, high volume at a higher price might indicate resistance, as it shows strong selling pressure.
Pivot Points
Pivot points are calculated using the previous day’s high, low, and closing prices and are commonly used in intraday trading to identify potential S&R levels for the current trading session.
- Support Levels (S1, S2) – These are calculated below the pivot point and suggest where the price may find support.
- Resistance Levels (R1, R2) – Calculated above the pivot point, indicating potential resistance areas.
Previous Breakout Levels
When a stock breaks through a resistance level, that level often becomes the new support. Similarly, when a stock breaks below support, that level can become new resistance.
- Support Becomes Resistance – If a stock falls below a key support level, that same price may act as resistance if the stock rebounds.
- Resistance Becomes Support – When a stock breaks above a key resistance level, that price may act as support in the future.
Multiple Timeframes
Cross-Timeframe Analysis – Traders often look at different timeframes (e.g., daily, weekly, monthly) to identify stronger and more significant S&R levels. Support or resistance on a longer timeframe (e.g., weekly) is generally more influential than one on a shorter timeframe (e.g., 15 minutes).
Confirmation Across Timeframes – When a support or resistance level appears in multiple timeframes, it gains more importance and credibility for traders.
Candlestick Patterns
Certain candlestick patterns (e.g., Doji, Hammer, Engulfing) often indicate potential support or resistance. These patterns signal market indecision and can suggest upcoming reversals at key levels.
- Support – A bullish engulfing pattern near support might confirm a reversal.
- Resistance – A shooting star near resistance could indicate a forthcoming drop.
Support and Resistance Reversals
Concept of Reversals
- Role of Market Psychology – Support and resistance reversals occur when a previous support level becomes resistance or a previous resistance level becomes support. This happens when the price breaks through these levels and traders shift their sentiment, leading to a change in market dynamics.
- Psychological Shifts – Traders who missed buying at support levels may attempt to enter the market when the price comes back to this level, but this time it acts as resistance.
- Sentiment Change – When prices break through resistance, bullish sentiment takes over, causing the former resistance level to act as new support.
Support Becomes Resistance (S→R)
When the price falls below a previously strong support level, it often retests that level, which now acts as resistance. This pattern occurs when bearish sentiment overwhelms buying pressure, pushing prices lower.
- Example – In the stock market, a stock might break below ₹1,000, which had previously acted as strong support. After falling below, any attempts to rise back towards ₹1,000 may face resistance, as sellers enter the market at that level.
- Psychology Behind S→R – Traders who bought near support and didn’t sell before the breakdown may seek to sell when the price returns to the former support level, turning it into resistance.
Resistance Becomes Support (R→S)
When a price breaks through a strong resistance level, it can flip into support as the breakout triggers new buying interest. This often happens in strong uptrends, where bullish momentum causes previous resistance to act as a new support level.
- Example – If a stock consistently fails to rise above ₹500 (resistance), but then breaks through, this level may act as support on future pullbacks.
- Psychology Behind R→S – Traders who missed buying at lower levels see the breakout as an opportunity to enter. This buying interest at the former resistance level turns it into support.
Role of Volume in Confirming Reversals
Strong volume at the point of a breakout or breakdown often confirms the reversal of support or resistance levels.
- S→R with Volume – If a stock breaks below support on high volume, it indicates strong selling pressure. When the price revisits the former support, it faces significant resistance as many traders try to sell off positions.
- R→S with Volume – If a stock breaks through resistance with substantial volume, the previous resistance becomes new support, as buyers confidently enter the market, validating the upward move.
Trendline Reversals
When a stock breaks above or below a trendline that had acted as support or resistance, the trendline often reverses its role.
- Uptrend Reversal – In an uptrend, when the price breaks below a rising trendline, it often retests the trendline as resistance before continuing downwards.
- Downtrend Reversal – Similarly, in a downtrend, a price breaking above a declining trendline may see the trendline act as support on the next pullback.
Moving Average Reversals
Moving averages, such as the 50-day or 200-day, can also flip from support to resistance or vice versa. For example, when a stock breaks below a key moving average, this level often switches from support to resistance.
- Example – A stock may repeatedly find support at its 50-day moving average in an uptrend. Once it breaks below this level, future attempts to rally may face resistance at this moving average.
Round Number Reversals
Psychological round numbers (₹100, ₹500, ₹1,000) that act as support or resistance often reverse roles once breached. Traders tend to place orders at round numbers, creating these key levels of support or resistance.
Price Consolidation and Breakout Reversals
Support and resistance reversals can also occur after price consolidates in a tight range, forming a support/resistance zone. A breakout from this range often leads to a reversal of roles.
- Breakout Confirmation – When the price breaks out above a resistance zone and consolidates, that zone becomes a new support level.
- Breakdown Confirmation – When the price breaks below a support zone and consolidates, it often acts as new resistance.
Support/Resistance Flip Confirmation Patterns
Certain candlestick patterns, such as bullish or bearish engulfing patterns, can help confirm S→R or R→S reversals. These patterns signal strong market sentiment shifts.
- Example – A bearish engulfing pattern forming at a newly created resistance level after the price breaks support can confirm the reversal, indicating continued downward pressure.
Importance of Multiple Timeframes in Reversals
Support and resistance levels identified across multiple timeframes (daily, weekly, monthly) tend to provide stronger reversal signals.
- Example – If a resistance level on a weekly chart is broken, it may act as stronger support on a daily chart, providing traders with a more reliable reversal signal.
Strategies for Trading with Support and Resistance
#1. Range Trading Strategy
Range trading is based on identifying a range where the price oscillates between support and resistance levels. Traders buy near support and sell near resistance in this bounded range.
- Buying at Support – Traders enter a long position near the support level, anticipating a reversal or bounce back towards resistance.
- Selling at Resistance – When the price approaches resistance, traders take profits or initiate short positions, expecting a decline toward support.
- Example – In the stock market, if a stock oscillates between ₹800 (support) and ₹900 (resistance), a trader might buy at ₹800 and sell at ₹900 multiple times while the range holds.
- Stop-Loss – To manage risk, traders typically place stop-loss orders slightly below support for long trades or above resistance for short trades.
#2. Breakout Strategy
A breakout occurs when the price moves decisively through a support or resistance level, signaling a potential new trend. Traders aim to capture the momentum that follows such breakouts.
- Buying a Breakout – Traders go long when the price breaks above a resistance level with strong volume, signaling a potential upward trend.
- Selling a Breakdown – Traders enter short positions when the price breaks below support, expecting further declines.
- Example – If a stock breaks above ₹1,000 resistance in the Indian market on high volume, a trader may buy, expecting continued upside momentum.
- Confirmation with Volume – Traders look for increased trading volume to confirm the breakout, as higher volume suggests greater market participation and likelihood of trend continuation.
- False Breakouts – Traders need to watch out for false breakouts, where the price briefly moves above resistance or below support before reversing. Using confirmation signals like candlestick patterns or momentum indicators helps avoid such traps.
#3. Pullback Strategy
After a breakout, prices often pull back to the previous support or resistance level before resuming their trend. Traders use these pullbacks to enter positions at more favorable prices.
- Buying on Pullbacks – After a breakout above resistance, the price may pull back to test the former resistance as new support. Traders buy at this pullback, expecting the price to resume its upward trend.
- Selling on Pullbacks – When the price breaks below support and then pulls back to test the previous support (now resistance), traders enter short positions, expecting the downward trend to continue.
- Example – A stock breaks above ₹500 (resistance), rallies to ₹550, and then pulls back to ₹500. Traders might buy at ₹500, anticipating that it will now act as support.
- Risk Management – Stop-loss orders are placed just below the new support (in case of long trades) or above new resistance (in case of short trades) to limit losses if the pullback fails.
#4. Trendline Strategy
Trendlines are dynamic support and resistance levels that connect the highs and lows of a trending market. Traders use these trendlines to identify entry and exit points within the prevailing trend.
- Buying in an Uptrend – Traders buy near an upward-sloping trendline that acts as support during an uptrend.
- Selling in a Downtrend – Traders short when the price touches a downward-sloping trendline that acts as resistance during a downtrend.
- Example – In an uptrend, if a stock touches an upward-sloping trendline at ₹450 multiple times, traders may buy on the next touch, expecting the trendline to hold as support.
- Stop-Loss Placement – Stops are placed just below the trendline (in an uptrend) or above the trendline (in a downtrend) to protect against a potential trend reversal.
#5. Moving Average Support and Resistance Strategy
Moving averages, especially the 50-day and 200-day, often act as dynamic support and resistance levels. Traders use these levels to identify buy and sell opportunities.
- Buying on Moving Average Support – Traders buy when the price pulls back to a moving average (e.g., 50-day moving average) in an uptrend, using it as support.
- Selling on Moving Average Resistance – In a downtrend, traders short when the price rallies up to a moving average (e.g., 50-day moving average), using it as resistance.
- Example – A stock in the Indian market might find support at its 200-day moving average. Traders can enter long positions when the price touches the moving average, expecting it to act as a support zone.
- Crossovers – Traders can also use moving average crossovers as entry signals. When a short-term moving average (like the 50-day) crosses above a long-term moving average (like the 200-day), it signals a bullish trend. The reverse crossover signals a bearish trend.
#6. Psychological Round Number Strategy
Traders use round numbers as psychological support and resistance levels. For example, levels like ₹1,000 or ₹10,000 often act as strong psychological barriers where traders set buy or sell orders.
- Buying at Round Number Support – Traders buy near round numbers (e.g., ₹500, ₹1,000), where large buying interest often emerges, creating a support zone.
- Selling at Round Number Resistance – When prices approach significant round numbers (e.g., ₹5,000), traders may take profits or initiate short positions, anticipating selling pressure and resistance at these levels.
- Example – If a stock in the Indian market reaches ₹10,000, traders may sell or short, expecting resistance at this psychologically important level.
#7. Fibonacci Retracement Strategy
Fibonacci retracement levels (23.6%, 38.2%, 50%, 61.8%) often act as support and resistance. Traders use these retracement levels to identify potential entry and exit points within a trend.
- Buying at Fibonacci Support – In an uptrend, traders buy near key Fibonacci retracement levels (e.g., 38.2% or 61.8%) as the price pulls back from its recent high.
- Selling at Fibonacci Resistance – In a downtrend, traders short near Fibonacci retracement levels as the price rallies.
- Example – If a stock rallies from ₹800 to ₹1,000 and pulls back to ₹900 (61.8% Fibonacci retracement), traders might go long, anticipating a continuation of the uptrend.
#8. Breakout with Retest Strategy
After a breakout through a key support or resistance level, prices often retest that level before continuing the trend. Traders use this retest as confirmation to enter a trade.
- Buying on Retest – When the price breaks above resistance and then pulls back to retest it, traders buy, expecting the breakout to hold and the uptrend to continue.
- Selling on Retest – When the price breaks below support and retests it, traders short, expecting the level to act as resistance and the downtrend to resume.
- Example – A stock breaks above ₹500, rallies to ₹550, and then pulls back to retest ₹500. Traders might buy on the retest, expecting the ₹500 level to act as support.
Limitations and Risks of Support and Resistance
Subjectivity in Identifying Levels
- Support and resistance levels can be subjective, and different traders may identify different price levels as significant. This variance can lead to inconsistency in trading decisions.
- Example – In the stock market, one trader may view ₹500 as a strong support level, while another may consider ₹480 as more critical, leading to potential differences in trading outcomes.
False Breakouts
- A common risk is the occurrence of false breakouts, where the price briefly moves beyond a support or resistance level but fails to continue in that direction. These false signals can trap traders into losing positions.
- Example – A stock may break above ₹1,000 (resistance), prompting a trader to go long, only for the price to reverse and fall back below ₹1,000, resulting in a loss.
- To reduce this risk, traders often look for confirmation signals, such as increased volume or the use of other indicators like moving averages or candlestick patterns.
Dynamic Market Conditions
- Support and resistance levels are not fixed; they can change as market conditions evolve. Factors like earnings reports, geopolitical events, or macroeconomic data can shift the balance of supply and demand, making previously reliable levels irrelevant.
- Example – In a volatile market, a support level at ₹800 might quickly become resistance if market sentiment suddenly turns bearish due to unexpected news.
Price Gaps
- Price gaps, especially those caused by significant overnight news or events, can skip over support and resistance levels entirely, leaving traders unable to react or adjust their positions.
- Example – A company’s unexpected earnings report might cause its stock to gap up above a major resistance level, bypassing the level and giving no opportunity for a planned trade entry.
Psychological Bias
- Traders can become emotionally attached to certain support or resistance levels, leading to overconfidence in those levels holding, even when market conditions suggest otherwise. This cognitive bias can result in holding onto losing positions for too long.
- Example – A trader may continue to believe ₹900 is a strong support level for a stock, even after the price has broken below it several times, leading to unnecessary losses.
Support and Resistance in Trending Markets
- In strong trending markets, support and resistance levels may not hold as expected. During strong bullish or bearish trends, prices can break through these levels repeatedly, making them unreliable for trading.
- Example – In a strong uptrend, a stock may break through multiple resistance levels without pausing, making it difficult to time trades based on resistance.
Over-Reliance on Historical Data
- Support and resistance are derived from historical price data, which may not always reflect future price action. Market conditions, sentiment, and fundamentals can change, rendering historical levels less useful in predicting future movements.
- Example – A support level formed months ago at ₹700 may no longer be relevant due to changes in the company’s fundamentals or external market conditions.
Risk of Consolidation and Sideways Markets
- In sideways or consolidating markets, prices may fluctuate between support and resistance without forming a clear trend. This can lead to multiple false signals and choppy price action, frustrating traders.
- Example – A stock might oscillate between ₹450 (support) and ₹500 (resistance) for an extended period, triggering numerous false signals for breakouts or breakdowns.
External Market Forces
- External factors such as government policies, interest rate changes, or global events can dramatically influence market sentiment, causing abrupt price movements that disregard traditional support and resistance levels.
- Example – A sudden announcement of regulatory changes in India’s financial sector could cause stock prices to react sharply, disregarding any existing support or resistance levels.
Incomplete Picture Without Other Indicators
- Relying solely on support and resistance without incorporating other technical or fundamental indicators can give an incomplete picture. Traders may miss critical signals or context, leading to poor decision-making.
- Example – A trader relying only on resistance levels may miss the underlying strength in a stock’s momentum, resulting in missed opportunities for profit as the stock continues its uptrend.
Tips for Using Support and Resistance Effectively
Use Multiple Timeframes
Analyzing support and resistance levels across different timeframes helps provide a clearer picture of significant price levels. Longer timeframes generally offer stronger and more reliable support and resistance.
Combine with Other Indicators
Support and resistance levels work best when used with other technical indicators like moving averages, RSI, MACD, or candlestick patterns. These indicators help confirm potential reversals or breakouts, increasing the probability of successful trades.
Look for Volume Confirmation
Volume plays a critical role in validating support and resistance levels. A price movement with strong volume near a key level increases the likelihood that the level will hold or break.
Identify Zones, Not Exact Levels
Treat support and resistance as zones rather than exact price points. Prices often overshoot or undershoot these levels slightly before reversing. Having a flexible approach allows you to avoid getting stopped out by minor fluctuations.
Use Trendlines to Identify Dynamic Support and Resistance
Trendlines can act as dynamic support and resistance levels in trending markets. These lines adjust with the price trend, offering better insights into the market’s overall direction.
Pay Attention to Round Numbers
Round numbers, such as ₹500, ₹1,000, or ₹2,000, often act as psychological support or resistance levels because traders tend to place buy or sell orders at these levels.
Wait for Confirmation on Breakouts
When prices break through support or resistance, wait for confirmation to avoid false breakouts. Look for price action, such as a retest of the broken level, before entering a trade.
Combine with Market Sentiment
Combine support and resistance analysis with broader market sentiment. News, economic reports, or sector trends can help you assess whether levels will hold or break.
Monitor Price Action Closely
Pay close attention to price action when the stock approaches support or resistance. Candlestick patterns like pin bars, hammers, or engulfing candles can signal potential reversals or breakouts.
Adjust Stop-Losses and Targets Based on Key Levels
Place your stop-loss orders just beyond support or resistance levels to reduce the risk of premature exits. Likewise, use these levels to set realistic profit targets.
Stay Flexible in Trending Markets
In trending markets, support and resistance levels may not hold as firmly, so it’s essential to stay flexible. Use them as guidelines, but be prepared for continuous breakouts and breakdowns.
Understand Market Cycles
Different market phases (uptrend, downtrend, consolidation) affect how support and resistance behave. In a consolidating market, prices often respect support and resistance more, while in a trending market, levels may break frequently.
Learn from the Market’s Reaction
Watch how the market reacts to support or resistance levels to refine your strategy. If a stock consistently bounces off a level, that level may grow stronger; if it breaks through easily, it may lose significance.
These tips aim to enhance traders’ understanding and use of support and resistance levels, helping them improve decision-making and increase the probability of successful trades.
This article introduces support and resistance levels in the Indian stock market. While we strive to ensure the information is accurate and up-to-date, trading and investing using support and resistance involves significant risks, and there are no guarantees of profit. The value of investments can fluctuate, and you may not get back the amount you originally invested.
The strategies and examples discussed are for educational purposes and should not be taken as investment recommendations. We do not endorse any specific securities, trading platforms, or strategies, nor do we encourage using support and resistance levels without thorough research and understanding.
Conduct your own research or consult with a financial advisor to develop a trading strategy that aligns with your financial goals and risk tolerance. Follow the entire series to build a comprehensive understanding of price action analysis and become a more informed trader or investor. Always trade responsibly and consider your financial objectives before engaging in any trading activities.